Sending logs from home network to Azure Log Analytics

.jpg)
I had this thought of using the power of the cloud to secure my home network - basically centralizing interesting logs from various devices on my home network in a Azure Log Analytics Workspace.
This would then let me work with this data across sources and play with fun KQL queries together with Azure Sentinel for alerts and automated responses.
As an example, how about joining the firewall logs with nginx access logs?
UnifiFirewallLogs_CL
| project SourceIP, DestPort_s, country_name_s, Rule_s
| join kind=leftouter  (
    NginxAccess_CL
    | project remote_s, path_s, code_s, agent_s
    ) on $left.SourceIP == $right.remote_s
| where path_s !in ("/", "")
| summarize makeset(DestPort_s), makeset(path_s), makeset(code_s), makeset(agent_s) by  SourceIP, country_name_s
| where array_length(set_path_s) > 0 or array_length(set_DestPort_s) > 1
Which yields interesting bits and pieces like this:
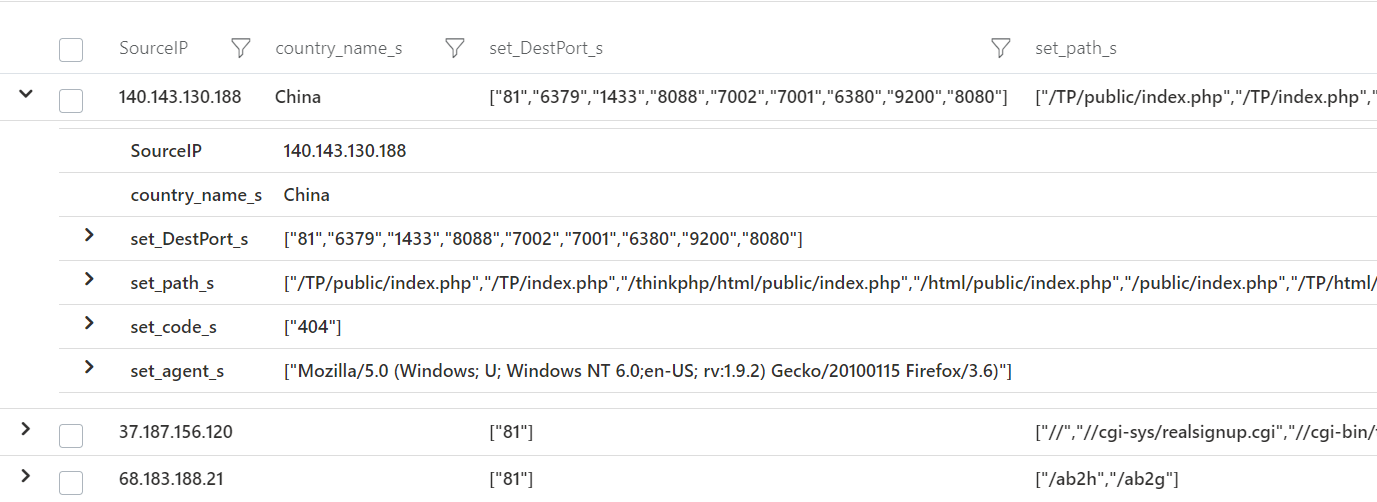
Which is kind of weird since none of these ports are open at my home network nor do I have anything that recognizes these HTTP requests - what on earth??
The setup
My home network consists of mostly Ubiquiti devices and looks like this, so far.
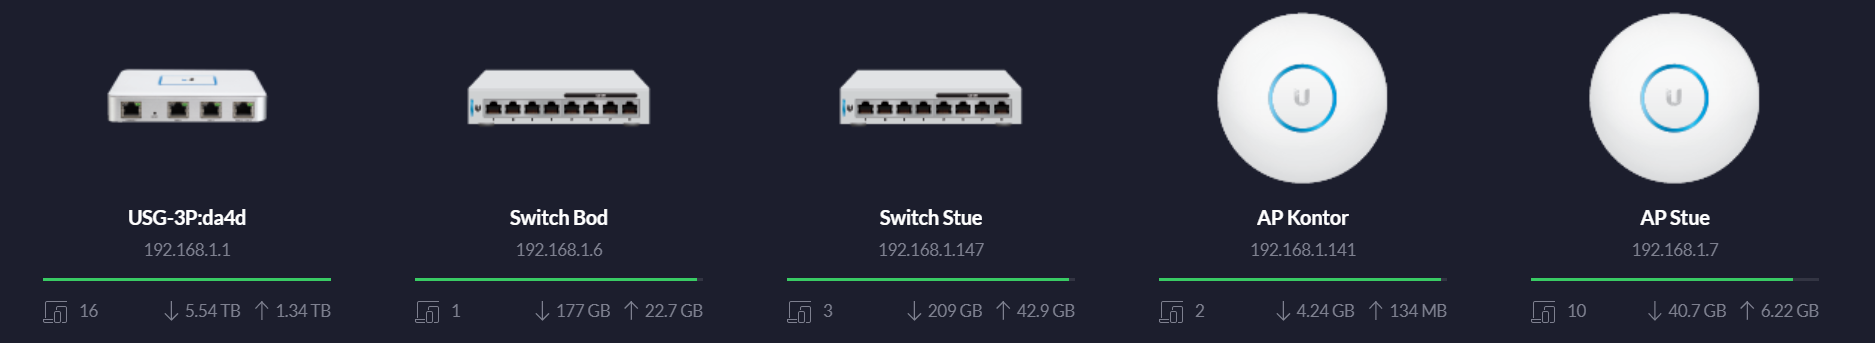
- Unifi Security Gateway
- 2 PoE switches
- 2 WiFi PoE access points
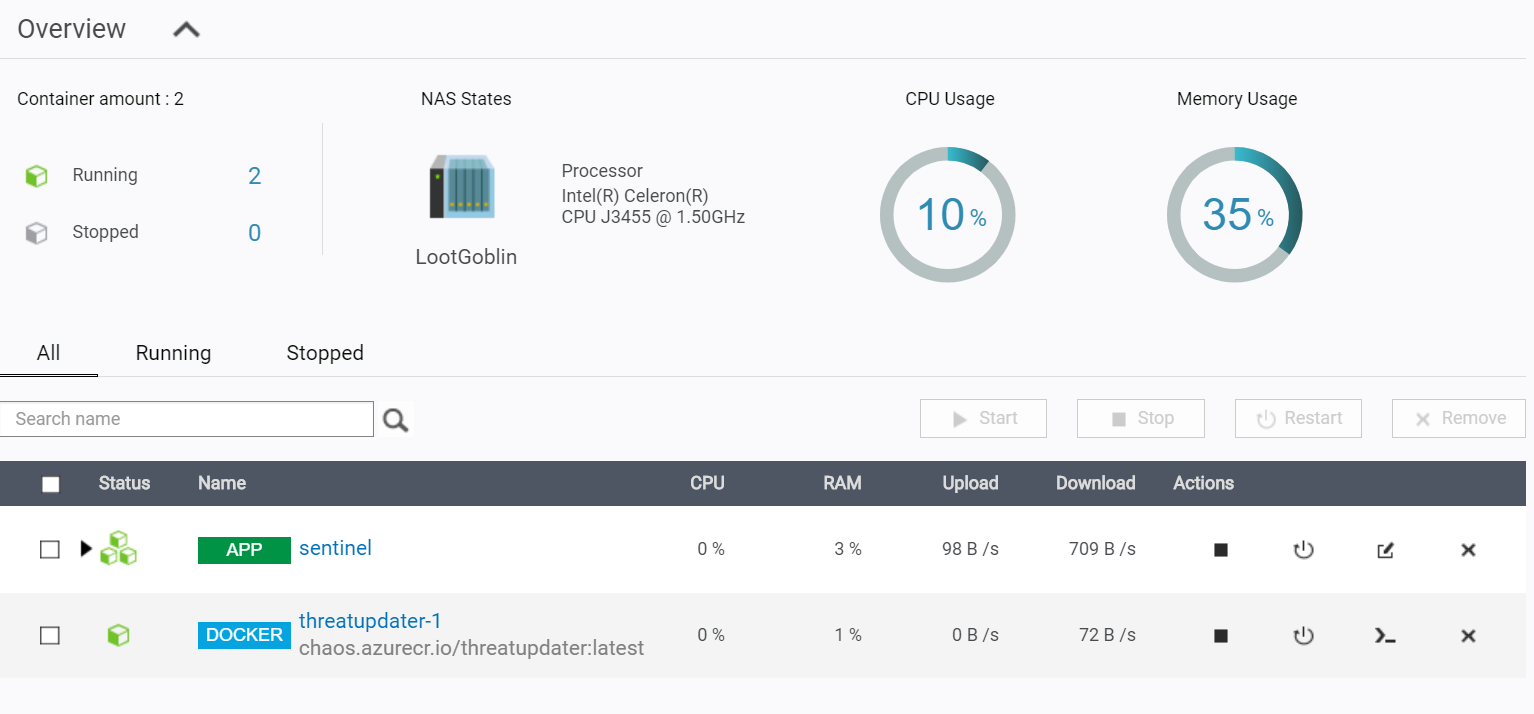
I also have a QNAP device for those NAS needs - but it also runs Container Station which is a QNAP application for running Docker containers. This will become important in just a minute.
The gathering of logs
So, I need to centralize my logs and all of these Ubiquiti-devices are Linux-based and runs syslog. This means I can have them forward logs to remote syslog servers and using the Unifi Controller software, this is quite easy to do.
The Unifi Controller lets me configure all the devices from one location and then pushes the updates out to those that needs to hear it.
Under Settings -> Controller Configuration -> Remote Logging I can then set the syslog server that all devices should send their logs to.
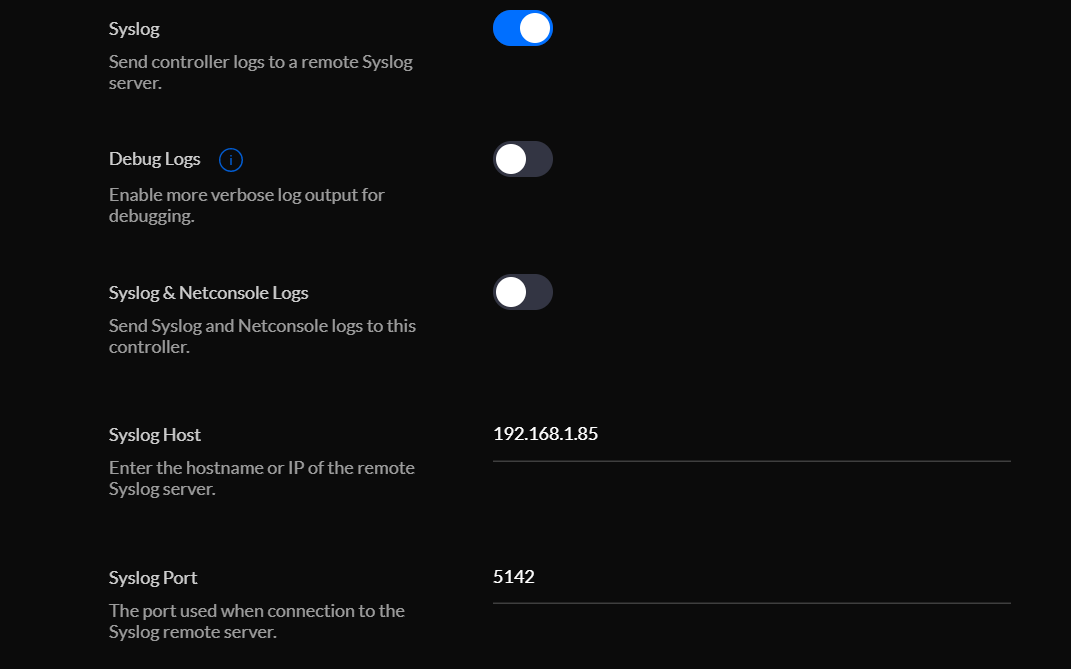
In this case, it's my QNAP NAS on a custom port.
But nothing is listening there - yet!
The log sink and forwarder
This won't be a introduction post to rsyslog and fluentd, but hopefully it's possible to follow along and get the gist of the setup.
I do enjoy Docker containers for their portability and re-usability. And they are so clean! If you throw one out, it leaves no dangling files or weird half-uninstalled bits and pieces.
And since my NAS already has a Docker container runtime installed and runs 24/7, perfect host for it.
What to put inside the container, though?
I decided on rsyslog and fluentd - the first to collect them and then pass them on to the second for further processing.
You could just go with fluentd as it can listen for syslog inputs, but I thought I'd let rsyslog do its thing and neatly organize the logs in separate folders on my NAS just in case I need them for something before shipping them off to fluentd.
But, mostly, I did it because it was a bit of a learning thing for me.
The Dockerfile consists of the following:
- Install
rsyslogand the required packages forfluentd(ruby-dev,build-essential, etc) - Use
bundlerto install the Ruby Gems forfluentdand the plugins I need (such asfluent-plugin-azure-loganalytics) - Drop privileges to a non-root user
- Set the startup command to a script which launches
rsyslogandfluentd
rsyslog.conf
The configuration for rsyslog is pretty much out of the box.
There are a few tweaks:
# Only enable TCP and UDP modules - don't need the rest
# provides UDP syslog reception
module(load="imudp")
input(type="imudp" port="5142")

# provides TCP syslog reception
module(load="imtcp")
input(type="imtcp" port="5142")

# set rsyslog to output each incoming log to a directory structure organized by hostname
$template RemInputLogs, "/sentinel/rsyslog/remotelogs/%HOSTNAME%/%PROGRAMNAME%.log"
*.* ?RemInputLogs
And then the important bit of sending it off to fluentd:
###########################
#### GLOBAL DIRECTIVES ####
###########################
# send all incoming logs to localhost on port 5140 (where fluentd will be listening)
*.* @127.0.0.1:5140

# set which networks are allowed to push log to this server
$AllowedSender UDP, 192.168.1.0/24, 172.0.0.0/8
$AllowedSender TCP, 192.168.1.0/24, 172.0.0.0/8
Test it out by executing rsyslogd -f ./rsyslog.conf -i rsyslog.pid
fluentd.conf
Now, configuring fluentd is where it gets interesting.
We need a few key pieces of information:
- The Azure Log Analytics Workspace ID
- The access key for said workspace
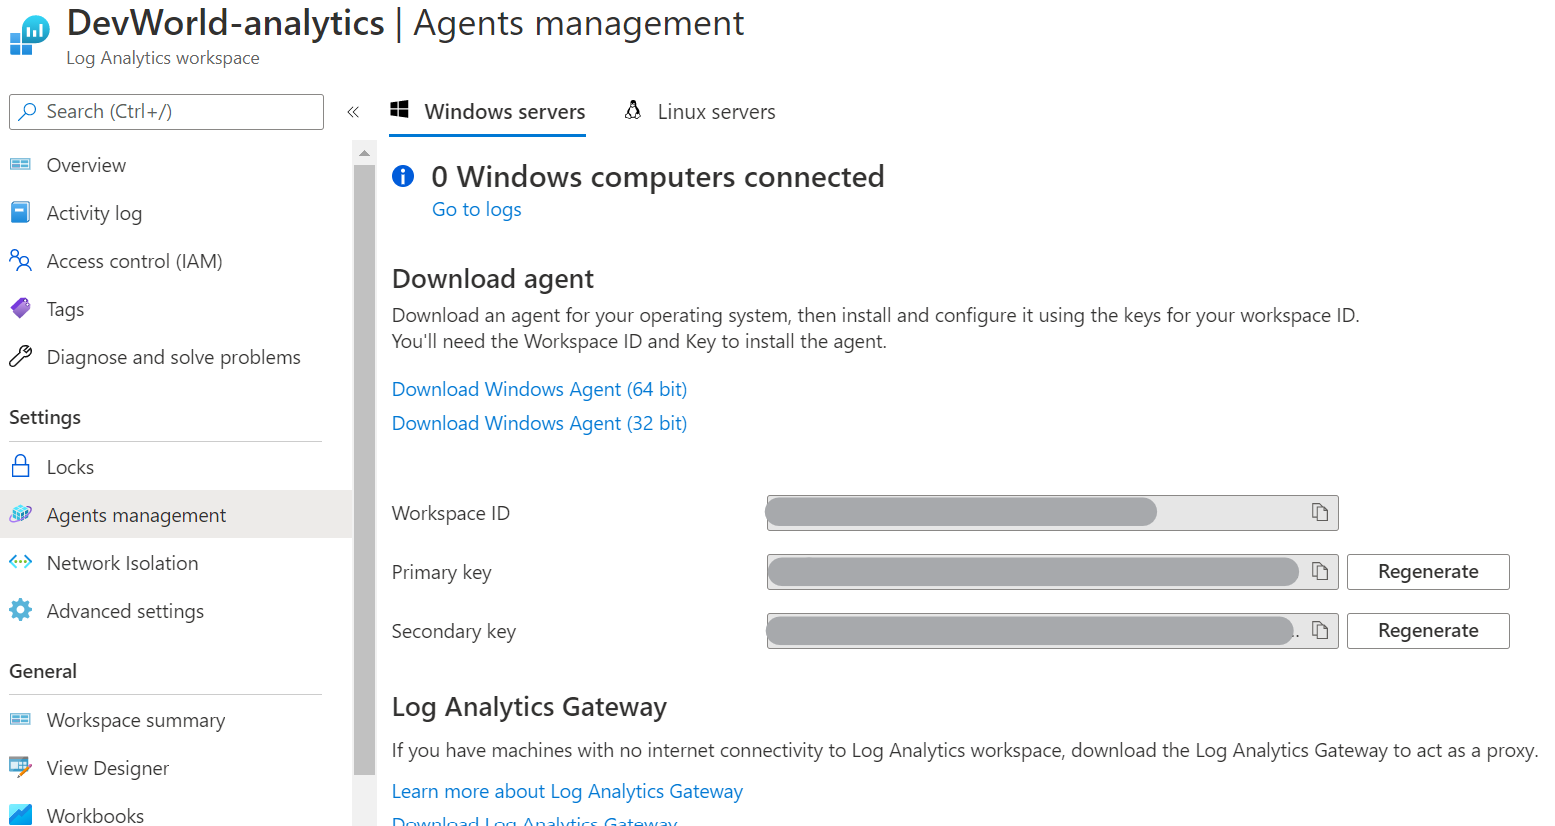
You can find this in the Azure Portal and under Agents Management of your Log Analytics Workspace
Now, our most simple form of the fluentd.conf we need a source for our logs - in our case, we already said to rsyslog that it should forward all logs to localhost port 5140 so lets listen for that.
<source>
  @type syslog
  port 5140
  tag syslog
</source>
We also give all this incoming data a tag of syslog so we can differentiate on different kind of sources, if need be.
Then, we need to pass it to Azure Log Analytics as that was the point of all of this in the first place.
<match *.**>
    @type azure-loganalytics
    customer_id WORKSPACE_ID # Customer ID aka WorkspaceID String
    shared_key KEY     # The primary or the secondary Connected Sources client authentication key
    log_type mylog  # The name of the event type. ex) ApacheAccessLog
    add_time_field true
    time_format %FT%T%z
    localtime true
    add_tag_field true
    tag_field_name tag
</match>
Of course, this only ships it off in its raw format - and that might be what you'd like. But it also means that all logs will end up in the same Log Analytics data source which will be quite messy - imagine a table with all thinkable columns from various log sources where some has data and others have none.
My current setup can be found here: https://github.com/FrodeHus/sentinel-log/blob/main/fluentd.conf
Going through each in turn, would make this a really long post.
What the configuration does is:
- Filter on a type of log coming in to reduce some noise
- Then use a plugin called
rewrite_tag_filterwhich lets us use regex to match the kind of log data and then rewrite the tag - such asfirewall.logs.tcp(it was originallysyslog, remember?) - For each of those new tags, add a filter that handles them specifically. This is because I want to extract certain key fields from the logs and discard noise data. Makes it easier to query later.
- I also have a filter for
firewall.*andnginx.*which uses the extracted IPs to do GeoIP lookup and augment the data records with location data (such as country, region, latitude, longitude etc) - Use various
matchentries to send the different kinds of log data to different Azure Log Analytics logs.
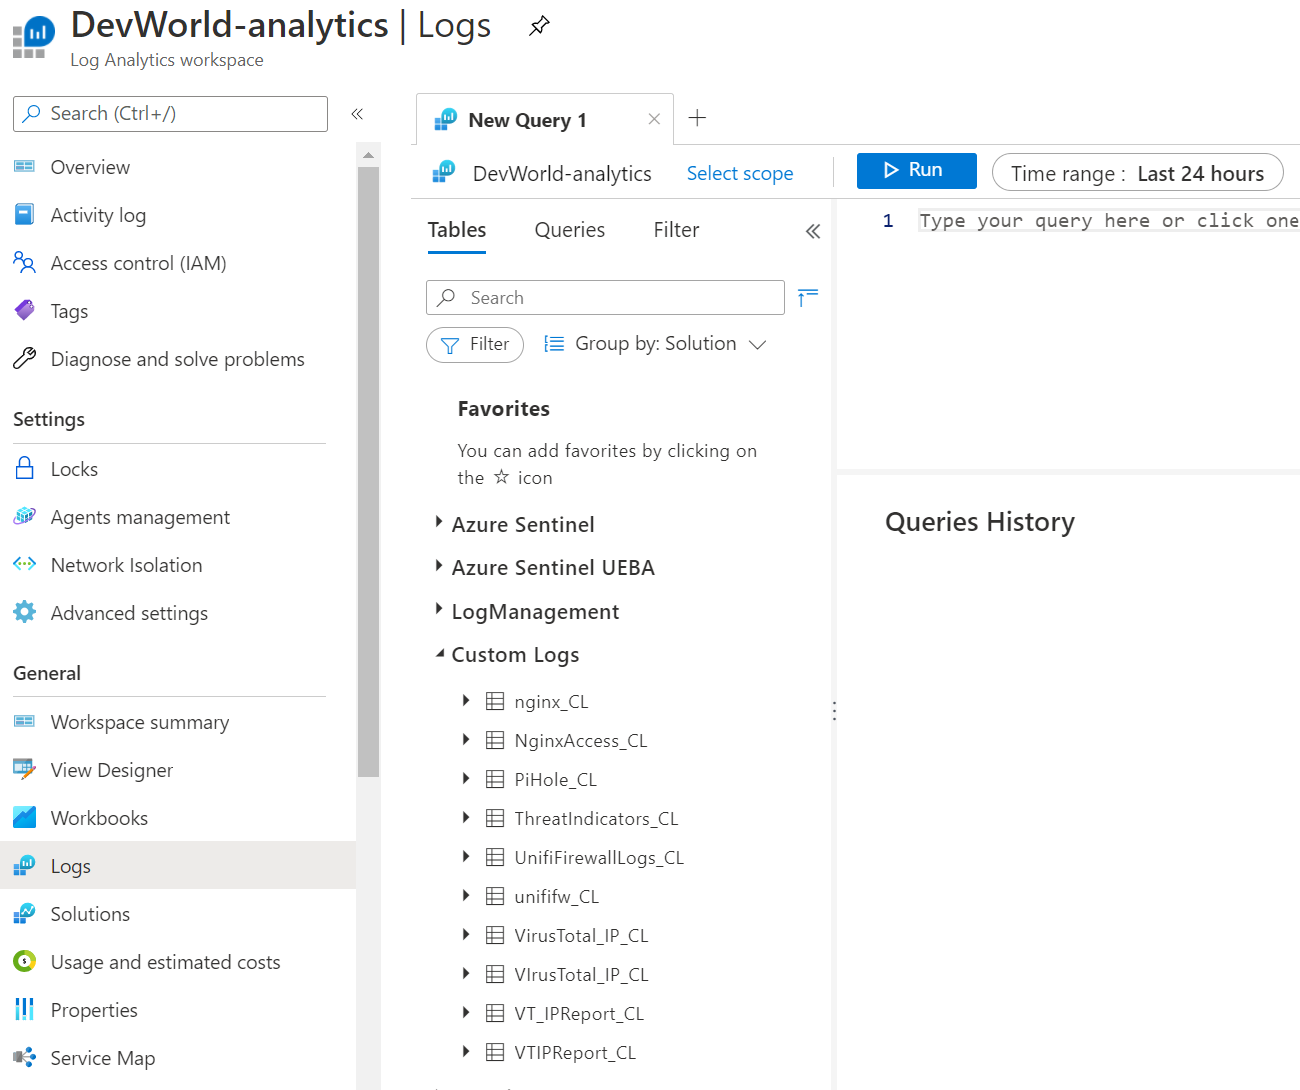
Once data starts trickling in, you should see it show up under Custom Logs in your workspace with the suffix _CL.
So, now the logs are "up there" - it becomes really interesting when you add Azure Sentinel on top of this coupled with Azure Logic Apps and automated firewall blocking.
More on that in another post - coming soon :)