Instrumenting Ghost with Application Insights
Track Ghost requests, performance, exceptions, dependency calls,etc with Application Insights using a custom Docker image.

The easy and safe way to run a blog would be to sign up for a hosted service, but instead I self-host. This is mainly because it serves as a way for me to develop my own skills around running Kubernetes (AKS) and working with containers.
There are official Docker images for Ghost, but I wanted some more control and customization - luckily, Jessica Deen already wrote about this so I could hit the ground running.
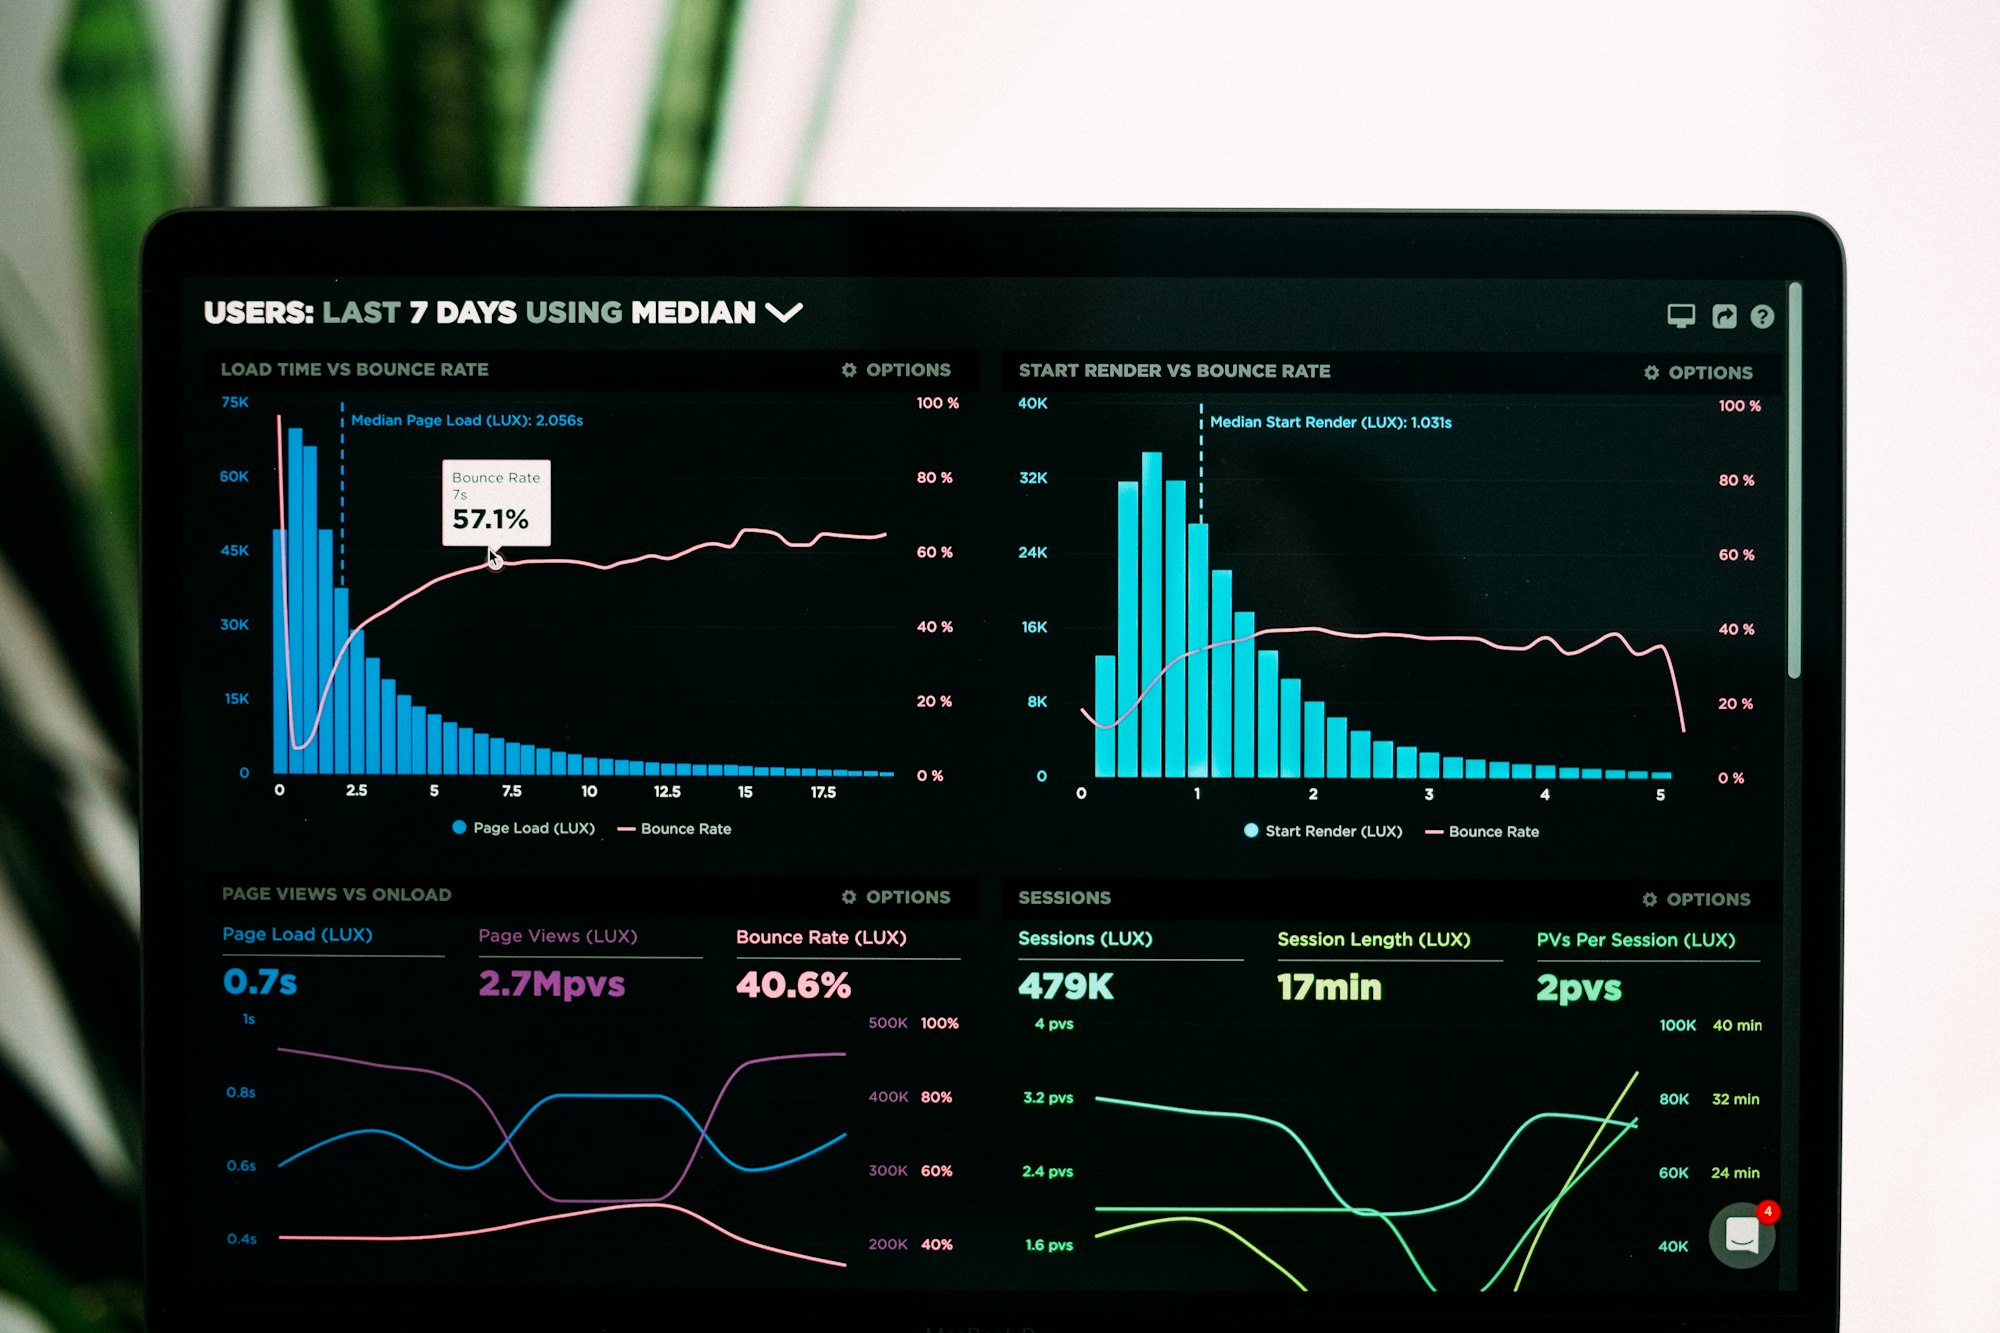
I also wanted to use Application Insights for all my monitoring and metrics. Now, this can be done by using the header injection bits in Ghost that lets you add custom javascript.
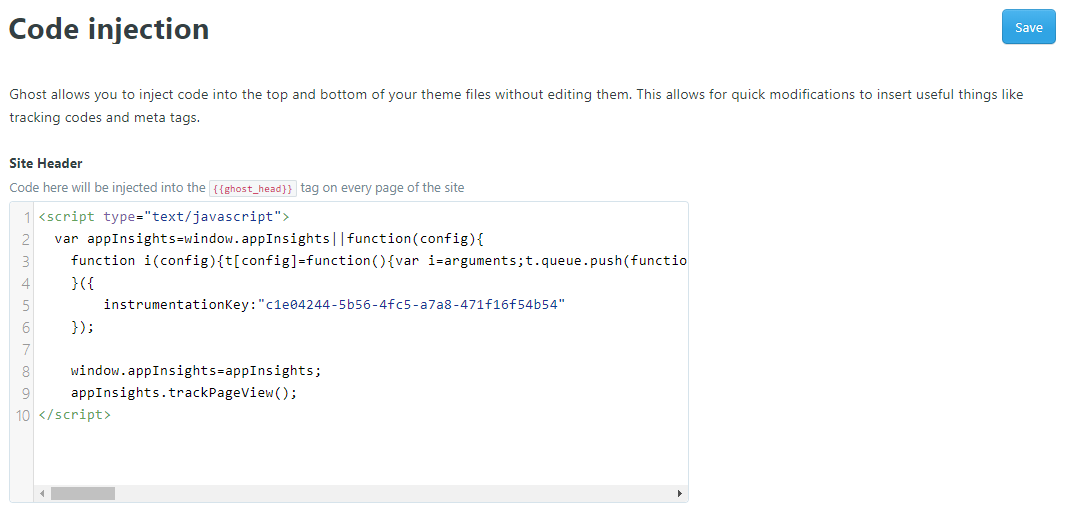
But this only gives you browser metrics - I want to track performance, exceptions, dependencies, application map, etc. This means we have to fiddle with the backend bits.
Adding Application Insights
The setup is pretty easy using the official documentation. I just had to work it into the Ghost index.js file.
So, I cloned https://github.com/TryGhost/Ghost and nabbed the index.js file and updated my Dockerfile.
FROM ghost:2.21-alpine

# set url-hostname for Ghost with build arg
ARG mode
ENV devMode ${mode}
ENV url ""

# copy config.production.json with db
COPY config.${devMode}.json config.production.json

#overwrite the shipped file with our own custom index.js
COPY index.js current/index.js

# copy themes/images to container
COPY content content

# Install the application insights npm package
RUN npm install ghost-storage-azure applicationinsights lightship
RUN cp -vR node_modules/ghost-storage-azure current/core/server/adapters/storage/ghost-storage-azure
Next, I modified index.js by adding the module and default init code:
var appInsights = require('applicationinsights');
appInsights
        .setup('your-instrumentation-key')
        .start();
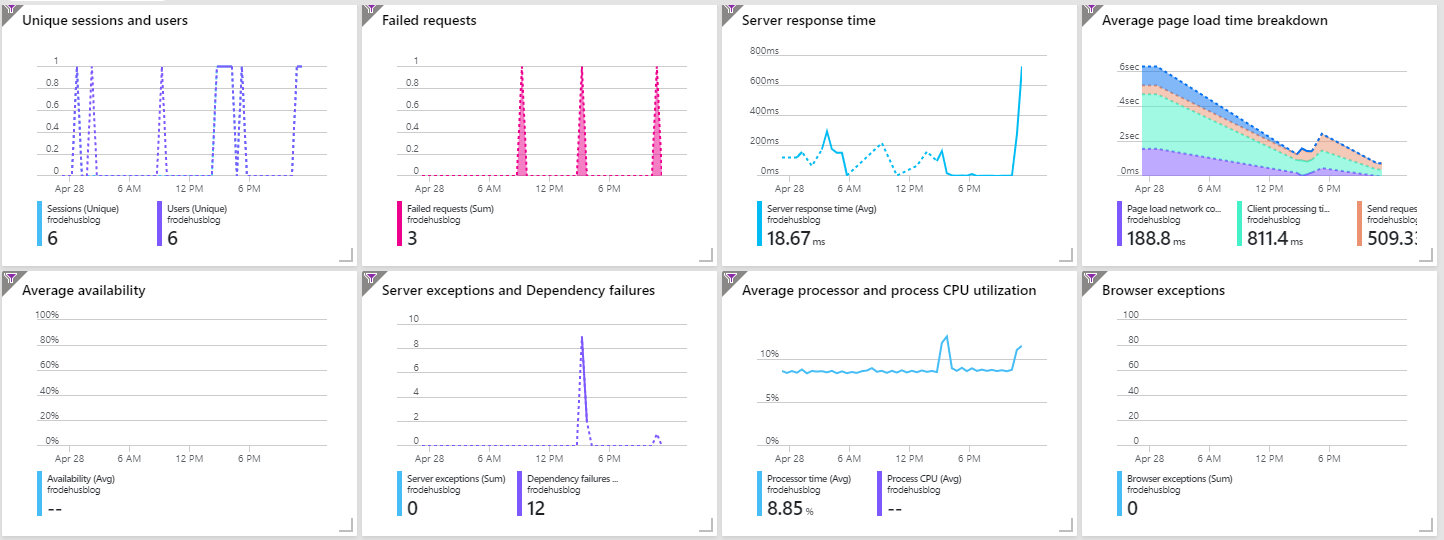
And that's all that is required to get all the tasty metrics from Ghost!
Downside is, of course, that now I have to maintain the index.js should it be updated. That's a trade-off I don't mind.
Extra credit
I also added lightship to enable health endpoints for my container so that Kubernetes can do its readiness and liveness probes.
Problem with Application Insights now reporting everything that goes on is that it also floods my logs with probe calls every 5 seconds. These are not the metrics I am looking for.
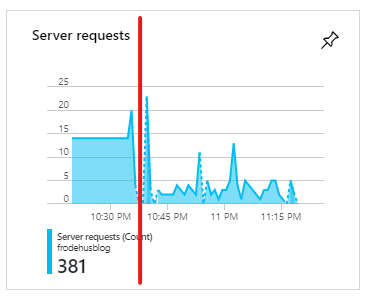
This is where Application Insights Telemetry Processors come into play - they let you get more control over your telemetry.
After initializing Application Insights in my index.js I then added a little snippet to skip any calls to /ready or /live.
function removeProbes(envelope, context){
        let data = envelope.data.baseData;
        if (data.url && (data.url.includes("/ready") || data.url.includes("/live")) )
        {
                return false;
        }
};

appInsights.defaultClient.addTelemetryProcessor(removeProbes);
And now my logs are noise free from probes.